Data Visualization Made Simple
Visualize Your Postgres Data in Minutes
Transform complex database queries into beautiful, interactive dashboards. Connect your Postgres database and start exploring your data with powerful visualizations.
Everything You Need to Visualize Data
Direct Postgres Connection
Connect securely to any Postgres database—whether hosted on AWS RDS, Google Cloud SQL, Azure, or your own infrastructure. Support for SSL connections, SSH tunneling, and read replicas ensures your data stays safe while remaining accessible.

Multiple Chart Types
Choose from over 20 chart types including line graphs, bar charts, pie charts, heat maps, scatter plots, and more. Each visualization is fully customizable with colors, labels, legends, and interactive tooltips to present your data exactly how you want.

Collaborative Sharing
Share dashboards with your team through secure links, embed them in your applications, or schedule automated reports via email. Set granular permissions to control who can view, edit, or manage each dashboard.

Scheduled Refreshes
Keep your dashboards up-to-date automatically with configurable refresh schedules. Set intervals from every minute to once per day, or trigger refreshes based on database events to ensure you always have the latest data.

Mobile Responsive
Access your dashboards anywhere, on any device. Our responsive design automatically adapts to smartphones, tablets, and desktops, ensuring your data looks great and remains interactive regardless of screen size.

Export & API Access
Export your visualizations as PNG, PDF, or CSV files for presentations and reports. Use our REST API to programmatically access dashboard data, create new visualizations, or integrate with your existing tools and workflows.
Powerful Features for Data Exploration
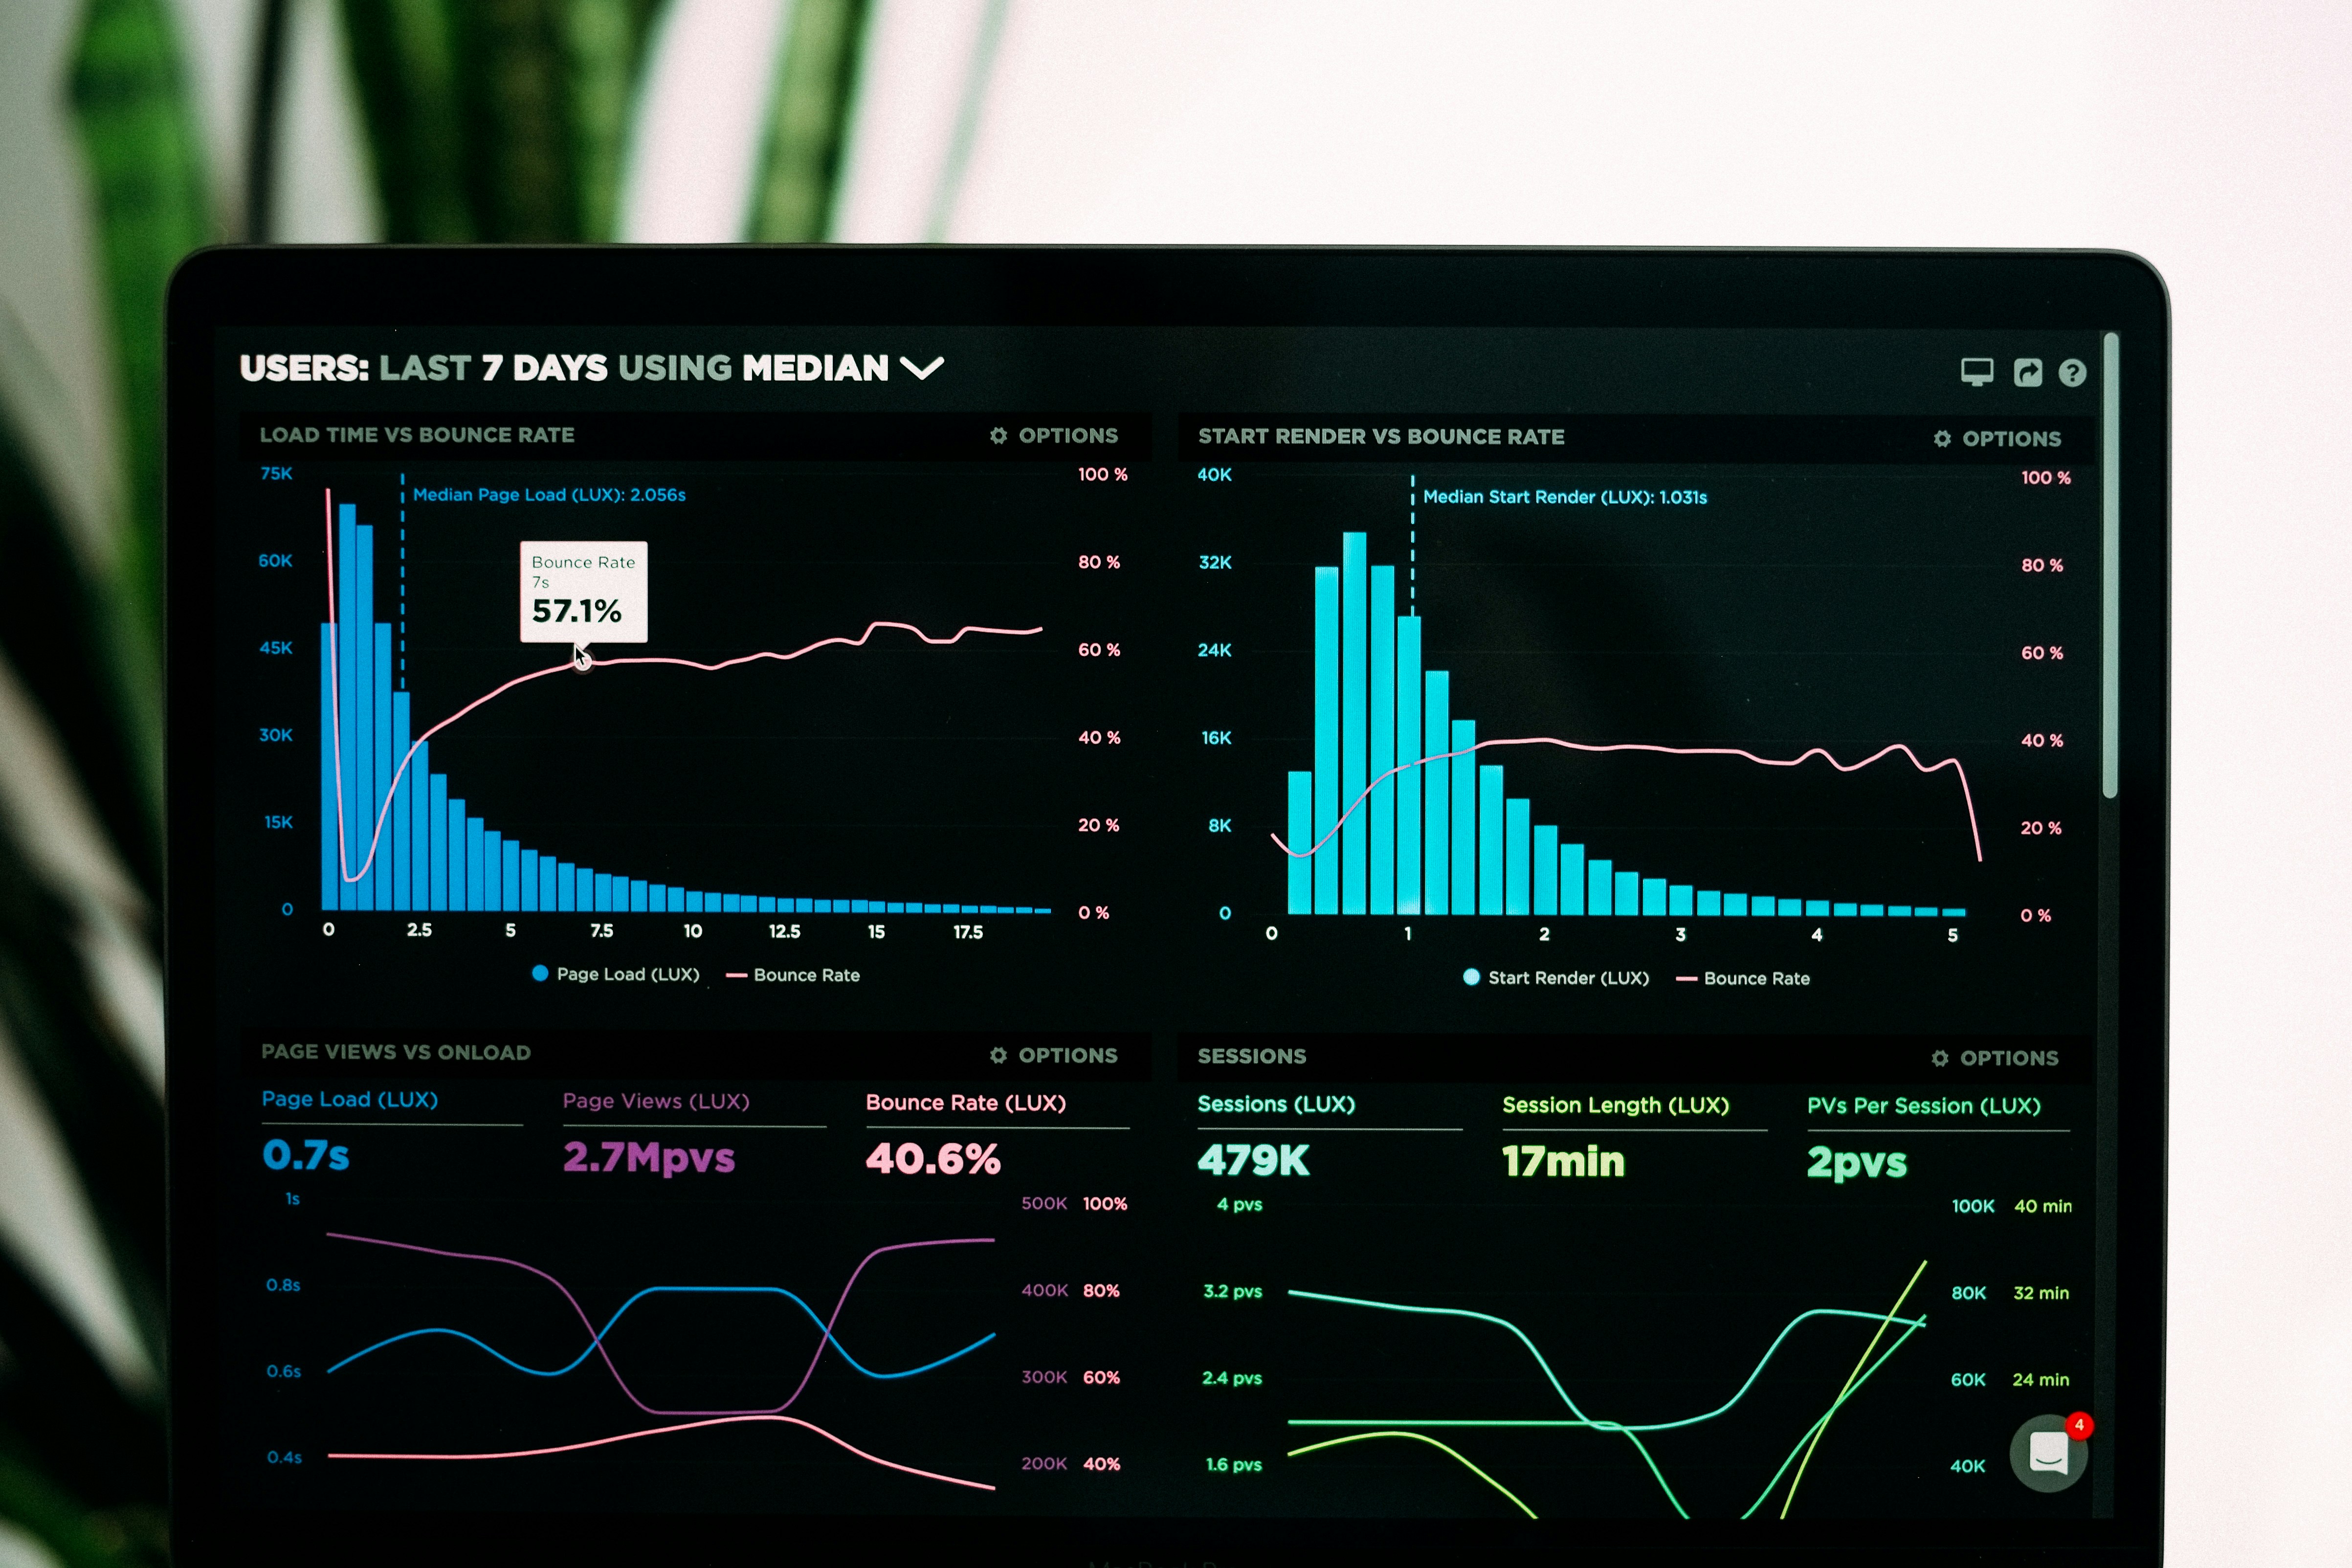
Transform complex SQL queries into stunning visual representations instantly. Watch your data come alive with interactive charts, graphs, and tables that update in real-time as your Postgres database changes. No more staring at raw query results—see patterns and insights at a glance.
Design dashboards that match your exact needs with our intuitive drag-and-drop interface. Arrange widgets, customize colors, and configure data sources without writing a single line of code. Create unlimited dashboards for different teams, projects, or use cases with complete flexibility.
Go beyond basic visualization with powerful analytics tools built right in. Apply filters, aggregations, and transformations to your Postgres data on the fly. Discover trends, outliers, and correlations with AI-powered insights that help you make data-driven decisions faster.
From Database to Dashboard in 3 Steps
-
01
Connect Your Database
Enter your Postgres connection details—host, port, database name, and credentials. We support SSL, SSH tunneling, and connection pooling. Test the connection with one click to ensure everything works before proceeding. Your credentials are encrypted and stored securely.
-
02
Build Your Visualizations
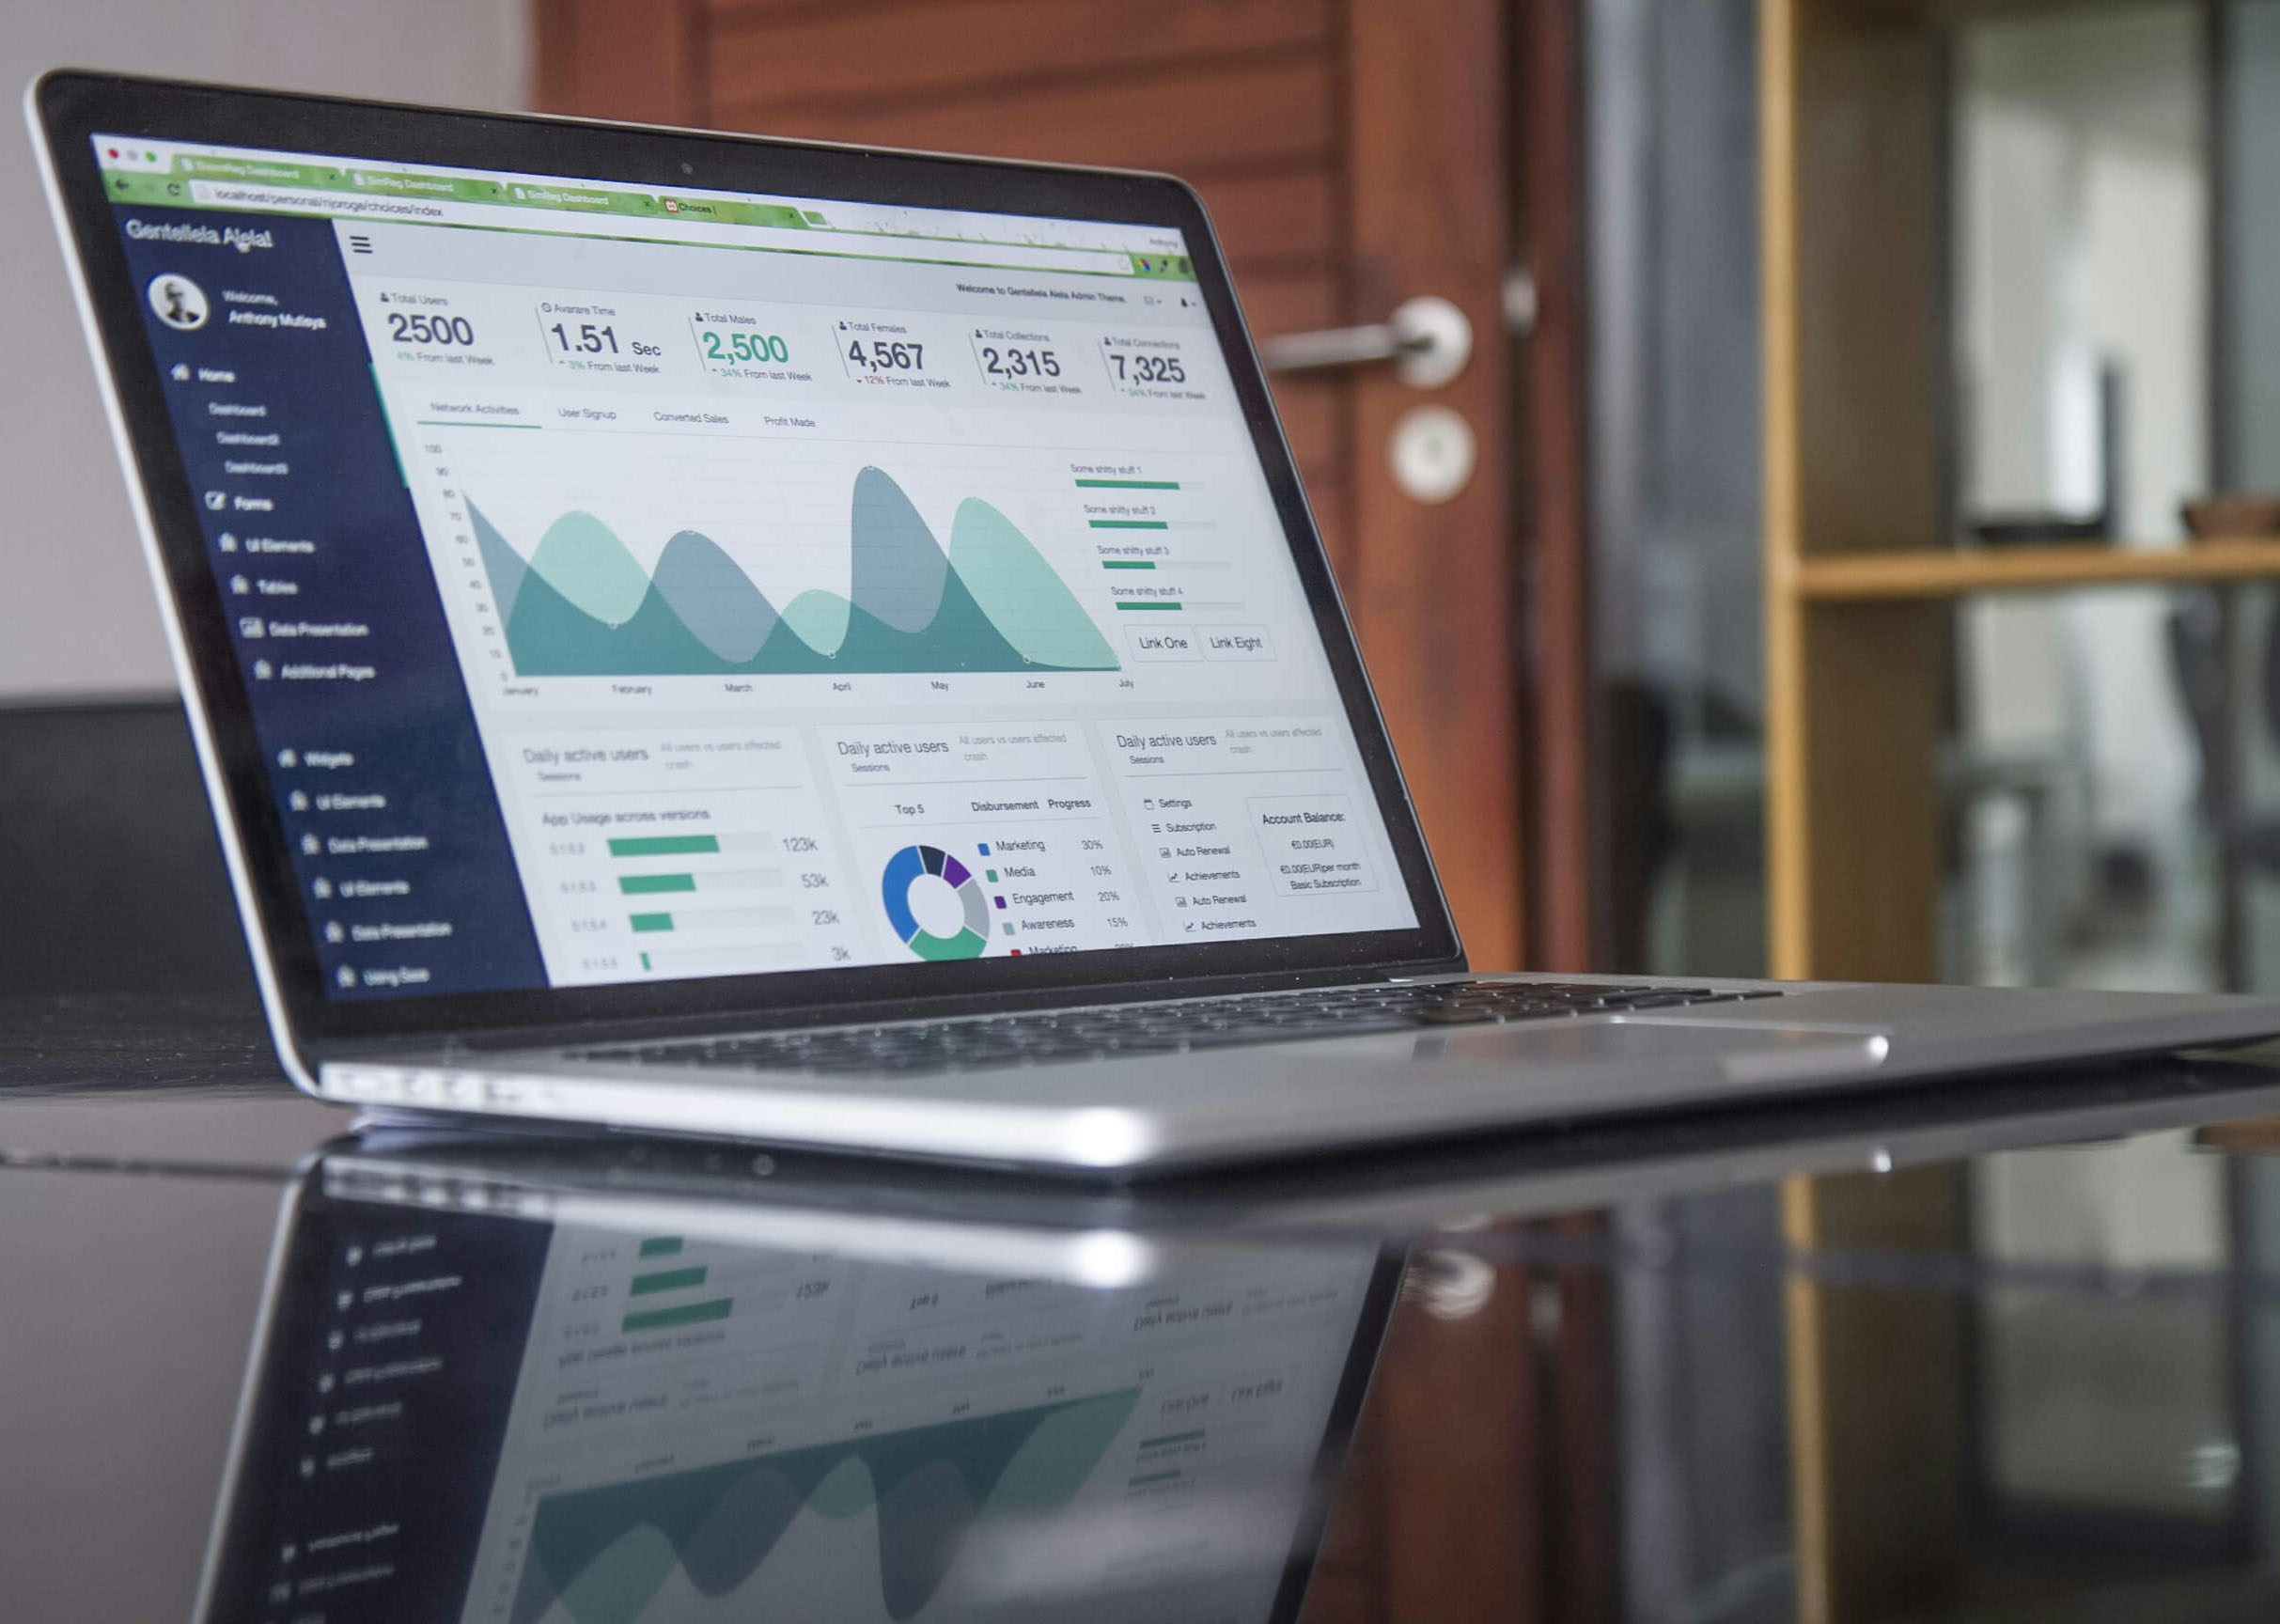
Write SQL queries or use our visual query builder to select the data you want to visualize. Choose from over 20 chart types, customize colors and labels, and arrange multiple widgets on your dashboard canvas. Preview changes in real-time as you build.
-
03
Share and Collaborate
Publish your dashboard and share it with your team via secure links or email invitations. Set permissions to control access levels, schedule automated refreshes, and enable email reports. Embed dashboards in your applications or export them as PDFs for presentations.
Seamless Postgres Integration
What Our Users Say
Postgres Dashboard transformed how our team works with data. What used to take hours of SQL queries and spreadsheet wrangling now takes minutes. The real-time visualizations help us spot issues before they become problems.

The ease of connecting to our Postgres databases and creating beautiful dashboards is incredible. Our executives finally have the real-time insights they need, and our data team can focus on analysis instead of report generation.

We evaluated five different dashboard tools and Postgres Dashboard was the clear winner. The combination of powerful features, intuitive interface, and excellent performance made it an easy decision. Highly recommended!

Trusted by Data Teams Worldwide

TechCorp Reduces Reporting Time by 80%
Challenge
TechCorp's data team spent over 20 hours weekly creating manual reports from their Postgres database. Stakeholders across five departments needed different views of the same data, leading to duplicated effort and inconsistent metrics.
Solution
They implemented Postgres Dashboard to create role-specific dashboards for each department. Automated refresh schedules ensured everyone saw real-time data, while shared templates maintained consistency across all reports.
Results
Reporting time dropped from 20 hours to just 4 hours per week. Data accuracy improved by 95%, and stakeholder satisfaction scores increased from 6.2 to 9.1 out of 10. The team now focuses on analysis instead of report generation.

HealthMetrics Improves Patient Care Insights
Challenge
HealthMetrics needed to visualize patient outcome data from their Postgres database to identify treatment effectiveness patterns. Their existing tools couldn't handle the complex queries required for meaningful analysis.
Solution
Using Postgres Dashboard's advanced analytics features, they built interactive dashboards that correlate treatment protocols with patient outcomes. Filters and drill-down capabilities let clinicians explore data at multiple levels.
Results
Clinical teams identified three previously unknown treatment optimization opportunities, potentially improving outcomes for over 5,000 patients annually. Dashboard adoption reached 92% among medical staff within two months.
Ready to Visualize Your Postgres Data?
Join thousands of data teams who have transformed their Postgres databases into actionable insights with beautiful, interactive dashboards. Start your free trial today—no credit card required. Connect your database and create your first dashboard in under 5 minutes.